

MWRA and the Department of Conservation and Recreation keep a daily watch on reservoir levels at Quabbin (412 billion gallon capacity) and Wachusett (65 billion).
While Wachusett levels are kept relatively fixed, Quabbin levels fluctuate with precipitation and watershed runoff.
Ware River stream flows are also watched daily to determine if seasonal transfers to Quabbin during high-flow periods are possible. To gauge current system status, water supply planners have identified six reservoir status conditions that allow for normal monthly fluctuation.
The Quabbin/Wachusett system is so large that it can withstand short- and medium-length droughts and dry periods without a significant impact on its operating levels.
Drought Status
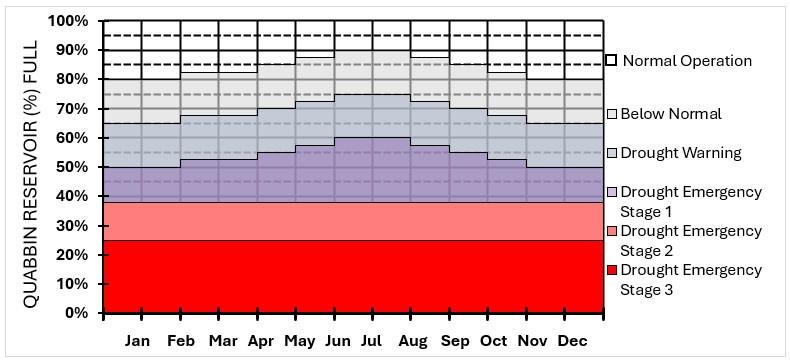
As of June 1, Quabbin Reservoir was in Below Normal status.
Advised Conservation Actions: Voluntary reductions and conservation actions. No mandatory restrictions on MWRA Communities. All partial and non-MWRA communities must follow state guidelines.
Drought Status Timeline: Quabbin has been in “Below Normal” since February 2026, and expected to remain in “Below Normal” for the next 12 months.
The MWRA Drought Response Plan emphasizes timely forecasting of drought impacts, enabling timely and progressive public conservation actions to influence water withdrawal behavior. The success of this approach relies on cooperation between MWRA and its member communities, as well as ongoing public education and engagement campaigns to reduce water consumption. Your daily activities using water make a difference.
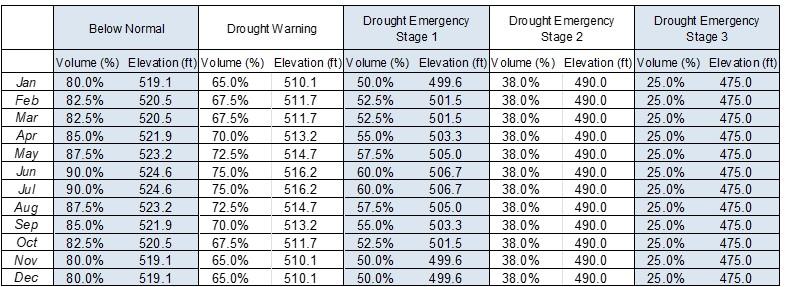
The MWRA Drought Response Plan defines drought stages based on the percentage of Quabbin Reservoir storage volume percentage full. Expected water levels vary by time of year, reflecting the reservoir’s seasonal fill and drawdown cycles. The Quabbin Reservoir’s elevation is reviewed on the first of each month to determine the drought trigger stage.
More information is available for communities, environmental groups, and individual customers covering a wide range of water conservation and efficiency topics can be found here.

Safe Yield
MWRA's source reservoirs, the Quabbin and Wachusett, can be counted on to safely provide about 300 million gallons per day of water even during periods of extended drought. This amount is called the "safe yield."
For a 20-year period from 1969 to 1988, the customers of MWRA (and its predecessor MDC) routinely drew more than the safe yield.
The chart Water System Demand 1980-2024 (PNG) demonstrates this historical trend. Fortunately, precipitation was great enough throughout these years to avoid a major water supply crisis. To address this problem, MWRA launched an aggressive water conservation program in 1986. By 1989, withdrawals had been brought below the safe yield, where they have remained ever since.
This reduction in average water use was achieved through:
- Vigorous leak detection and repair efforts on MWRA and community pipes
- Retrofitting 370,000 homes with low-flow plumbing devices
- A Water Management Program for area businesses, municipal buildings and nonprofit organizations
- Extensive public information and school education programs
- A change in the state plumbing code requiring new toilets to be 1.6 gallon per flush
- Meter improvements that helped track and analyze community water use
- New water-efficient technology that has created reductions in residential use
- Water pipeline replacement and rehabilitation projects throughout the MWRA and community systems
Managing Demand
Information on water use, system yield, watershed precipitation and levels of the Quabbin Reservoir are tracked on a daily and monthly basis. Based on a detailed analysis of major factors affecting water demand, MWRA projects that system demand will remain well below 300 million gallons per day.
A review of demand and supply conditions (PDF), presented to the MWRA Board of Directors in March 2025, provides more detail on long term trends.
| Water System Demand | |
|---|---|
| In 2024, water system demand was 201.2 million gallons per day, average (mgd/avg)** preliminary | |
| 2023 | 194.3 mgd/avg |
| 2022 | 207.57 mgd/avg |
| 2021 | 191.82 mgd/avg |
| 2020 | 195.76 mgd/avg |
| 2019 | 191.8 mgd/avg |
| 2018 | 199.98 mgd/avg |
| 2017 | 195.40 mgd/avg |
| 2016 | 208.01 mgd/avg |
| 2015 | 206.57 mgd/avg |
| 2014 | 200.85 mgd/avg |
| 2013 | 202.80 mgd/avg |
| 2012 | 194.70 mgd/avg |
| 2011 | 196.60 mgd/avg |
| 2010 | 204.30mgd/avg |
| 2009 | 194.30 mgd/avg |
| 2008 | 205.60 mgd/avg |
| 2007 | 219.90 mgd/avg |
Water Reservoirs
Active Supplemental Supply
MWRA stores treated water in covered tanks across its service area. Water can also be drawn from the Ware River if needed.
Emergency Back-up Sources and Storage
MWRA maintains a system of back-up reservoirs at points throughout its system for emergency use.